📈 Level 2: Read a Chart
You don’t need to predict the market — just learn to recognize how price moves and what it feels like on a chart. At this level, we don’t guess the future. We observe the present.
🎯 Objective
Learn how to read price action by identifying:
- Trend direction (uptrend, downtrend, or range)
- Support and resistance zones (where price reacts)
- Market mood and behavior (greed, fear, hesitation)
🔍 Terms to Know
- Support: A level where price often “bounces” upward
- Resistance: A level where price often “rejects” downward
- Trend: General direction of price (up, down, sideways)
- Volume: Number of shares/contracts traded during a period
Want more terms? Explore the glossary tab in the Trader's Toolkit Glossary.
🖼️ Chart Styles: Line vs Candlestick
When you open a chart, you’ll usually see one of two types:
- Line Chart: Plots only the closing price over time. It’s clean and simple — good for spotting big-picture trends but lacks detail.
- Candlestick Chart: Shows open, high, low, and close for each time period. It reveals more market emotion and is the standard for most traders.
I primarily use candlesticks — they show rejection, conviction, and indecision better than any other format. While that is the case line charts are just as valuable. Remember this is your experience, try what works best for you.
🔗 Want to explore both styles? Try TradingView — it offers both free and paid options.
🧰 Tools You’ll Use
- Charting platform: TradingView, Webull, or your broker’s terminal
- Timeframe: Start with Weekly or Daily Candles to spot clean structure
- Drawing tools: Trendlines, horizontal lines, price labels
🧠 Why It Matters
- Charts reflect crowd psychology. Every candle is a battle between fear and greed.
- Indicators lag, price leads. Learning the chart first builds your instincts.
- Seeing structure = seeing opportunity. Great trades begin with clear setups.
🎮 Your Mission
Pick one stock or ETF and do a raw chart read with no indicators.
- ✅ Identify trend (up / down / sideways)
- ✅ Mark at least 2 support + 2 resistance zones
- ✅ What trends or shifts do you notice?
- ✅ Log your notes in the Disciplined Trader Journal
📷 Example Chart
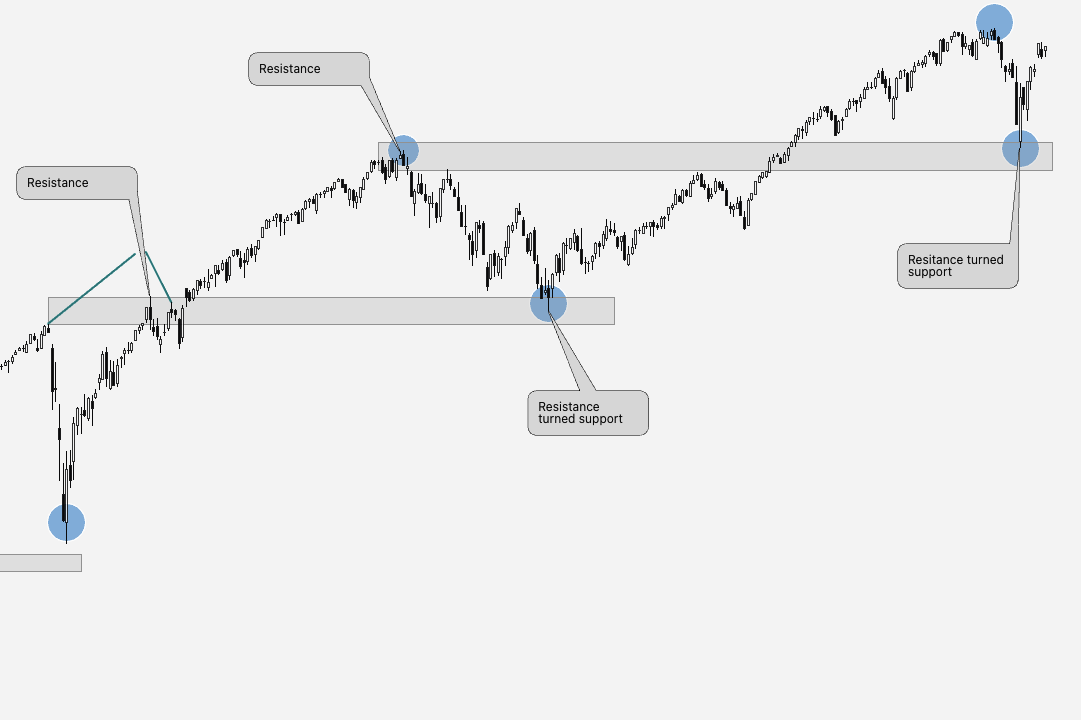
Look for: Higher highs, lower lows, candle reactions at key zones, momentum shift candles.
You’re not forecasting — you’re listening. The chart is telling a story. Your job is to slow down, read it, and respond with clarity.
Ready? Build your watchlist →